The EFAS long-range forecasts comprise two model systems; seasonal (SEAS) and sub-seasonal to seasonal (S2S) outlooks. The two systems use different meteorological forcing in their model chain (for details, please visit this page: EFAS Meteorological forecasts) and they are issued with different frequency. The SEAS forecast is issued at monthly where as the S2S is issued twice weekly, on Mondays and Thursdays.
The forecasts provide hydrological outlooks which show the likelihood of high or low flows within the coming six (S2S) and eight (SEAS) weeks in a region (aggregation of river basins). The regions were defined by merging river basins in order to capture the large-scale variability in the weather, while still respecting the underlying hydroclimatic boundaries. The hydrological outlooks are created by comparing the forecasts with EFAS low and high flow thresholds, each averaged over the defined regions. The schematic below illustrates how the EFAS S2S and SEAS outlooks are produced.
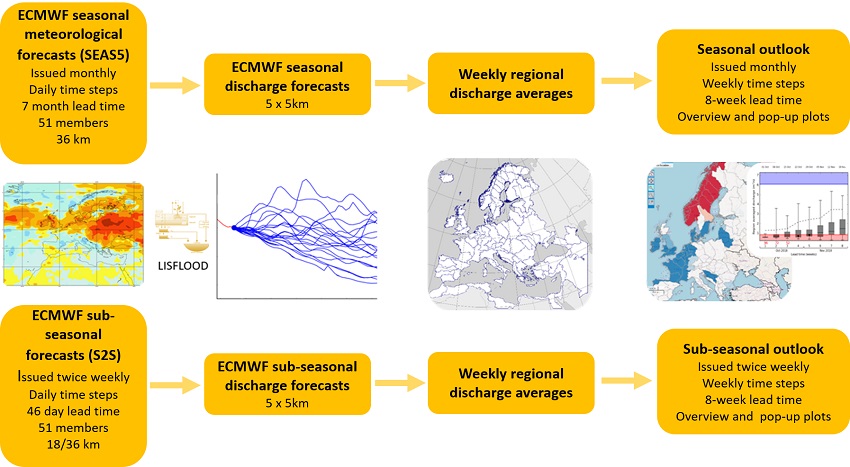
EFAS seasonal and sub-seasonal products
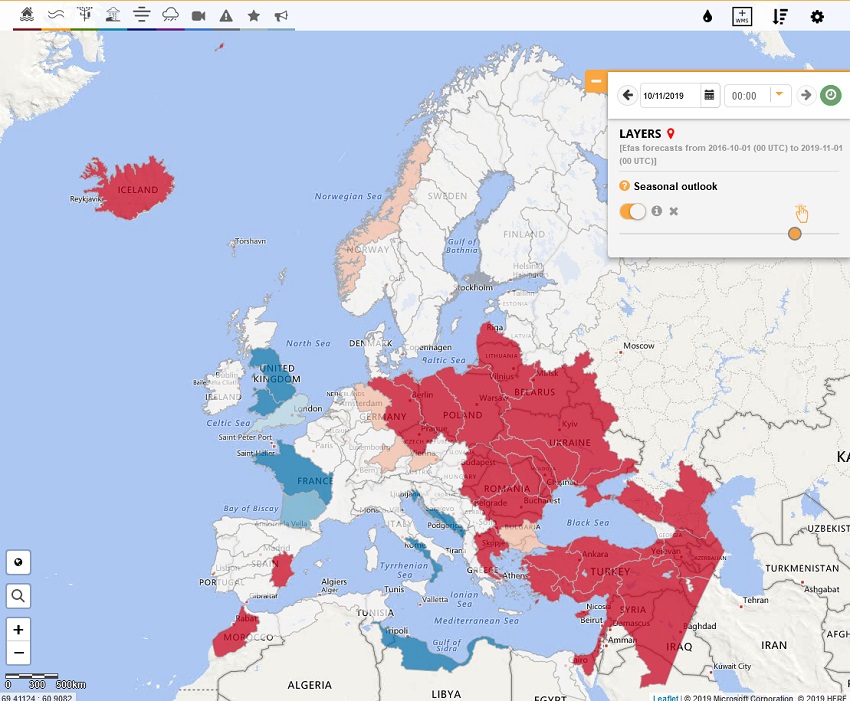
The outlook products produced for all regions at the start of each forecast are made available by the ”Seasonal outlook” and "Sub-seasonal outlook" layers.
- Overview map: regional discharge anomaly over the forecast horizon, highlighting regions with highest or earliest probability of a high (>90th percentile) or low (<10th percentile) discharge anomaly.
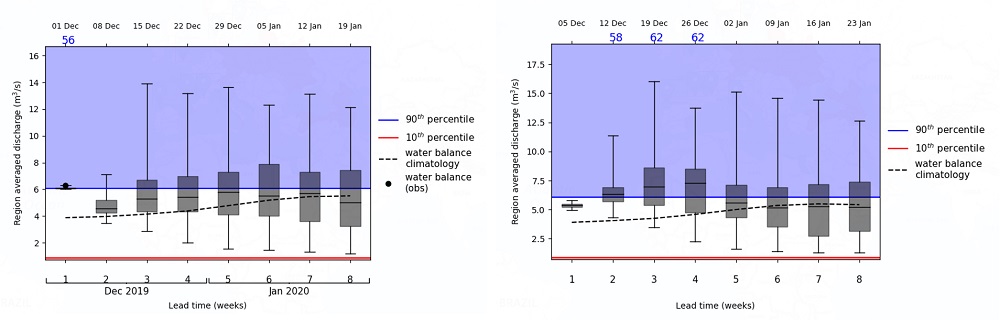
- Time series information: weekly averages of ensemble discharge forecast as box plots. The seasonal forecasts (left) are updated weekly with the latest LISFLOOD discharge simulation to help the forecaster with real-time validation. The sub-seasonal forecasts (right) are updated biweekly to give the user the latest forecast information.