Summary
- Roughly half of the survey recipients reported an observed flooding event tied to the sent notification. The percentage of received feedback is slightly lower compared to previous years.
- It was much more common that the flood notification indicated a more severe flooding compared to the observations than a less severe flooding compared to the observations.
- The notifications had good accuracy in terms of magnitude. The accuracy in terms of time and location could be improved.
- The majority stated that the return period of the observed flood event was less than 5 years. It would maybe be of use to define the actual discharge value to be evaluated by the partner, and hence avoid the use of different return period thresholds.
- The most common cause of the 2018 flooding events was extreme rainfall and snowmelt.
- The main reason for no observed flooding is expected to be precipitation that happened in a different region and subsequently the flood event potentially happened in another region.
Overall response
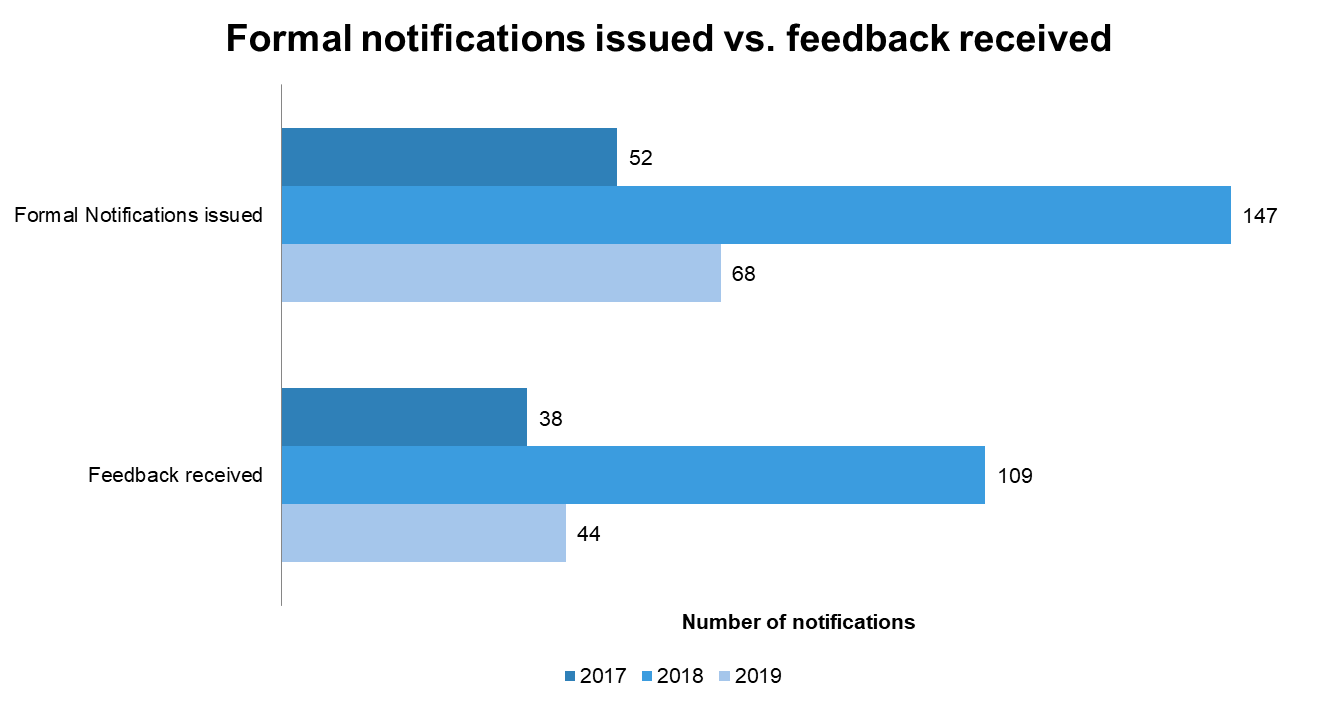
This report is based on feedback on formal notifications collected from EFAS partners during between May 2018 - April 2019 (referred to as "2019"). A total of 68 formal notifications were sent out during that period, and 44 event reports were received which accounts for 65% of all issued formal notifications. This is a decrease compared to last specific contract for which 74% of the formal flood notifications were reviewed (Figure 1).
The initial question in the feedback form is whether a flood event was observed with respect to the issued notification or not (Figure 2). The definition of a flood event is included in the question (return period equal to or larger than 2 years) to help partners assessing the event. The 2-year return period was chosen as flood definition for this question since this allows the differentiation between correct rejections and flood events that happened but not reached the 5-year return period.
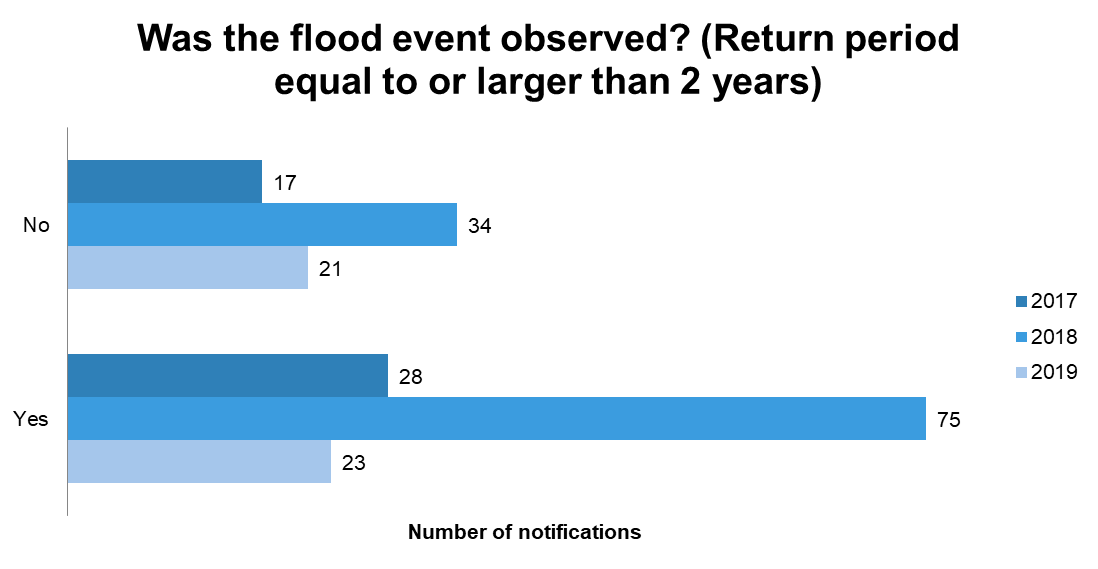
23 out of 44 respondents (52%) answered that the flood event was observed after a notification had been sent out. Note that a “yes” does not guarantee that the flood event exceeded the 5-year return period threshold (Figure 7). This is a much higher percentage of "no" floods during 2019 compared to previous years.
Accuracy of notifications for observed events
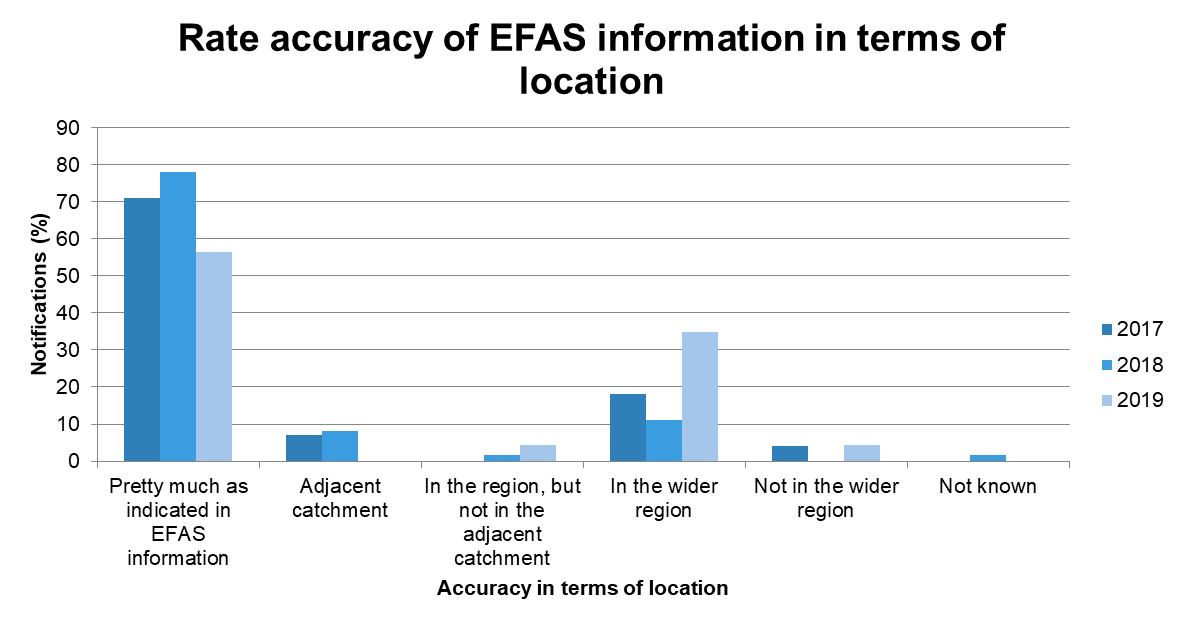
Most of those who answered that the flooding event had indeed occurred (13 out of 23, or 57%) rated the accuracy of EFAS information in terms of location as “Pretty much as indicated in EFAS information” (Figure 3). The largest difference compared to previous years with regards to the accuracy in terms of location is a decrease of answers "pretty much as indicated" and an increase in "in the wider region".
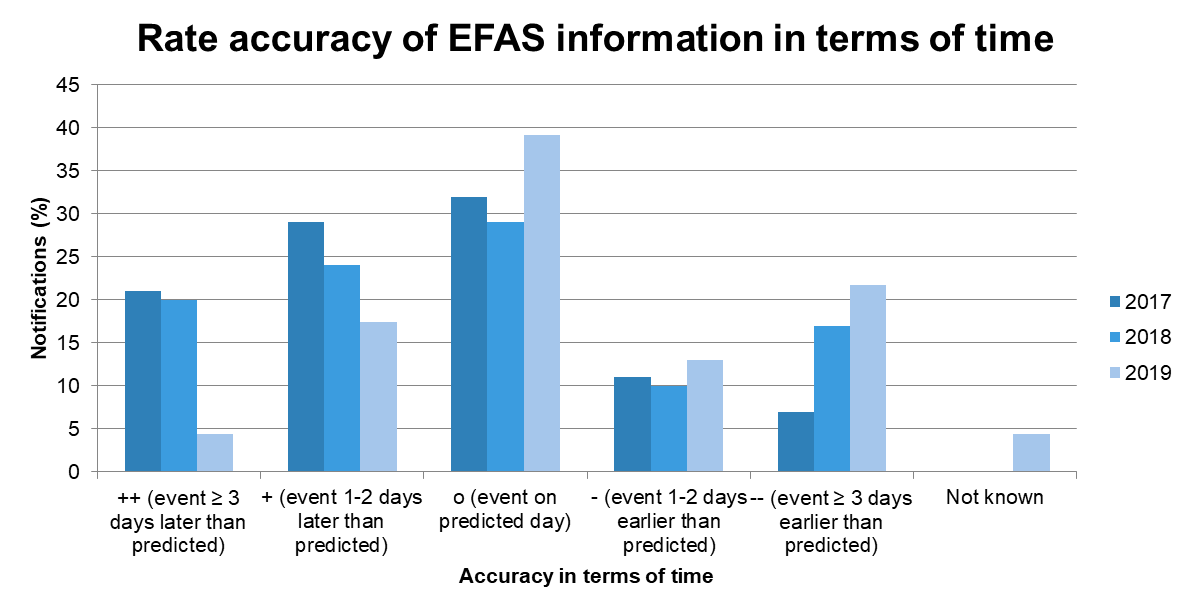
In total, 39% of those who answered that the flooding event had indeed occurred stated that the flood event happened on the day predicted by EFAS (Figure 4). There was more spread in the other answers with slightly more events that happened earlier than predicted (35%) than later than predicted (22%). Compared to previous years this is an improvement in accuracy in terms of time concurrent with a shift from later than predicted to earlier than predicted.
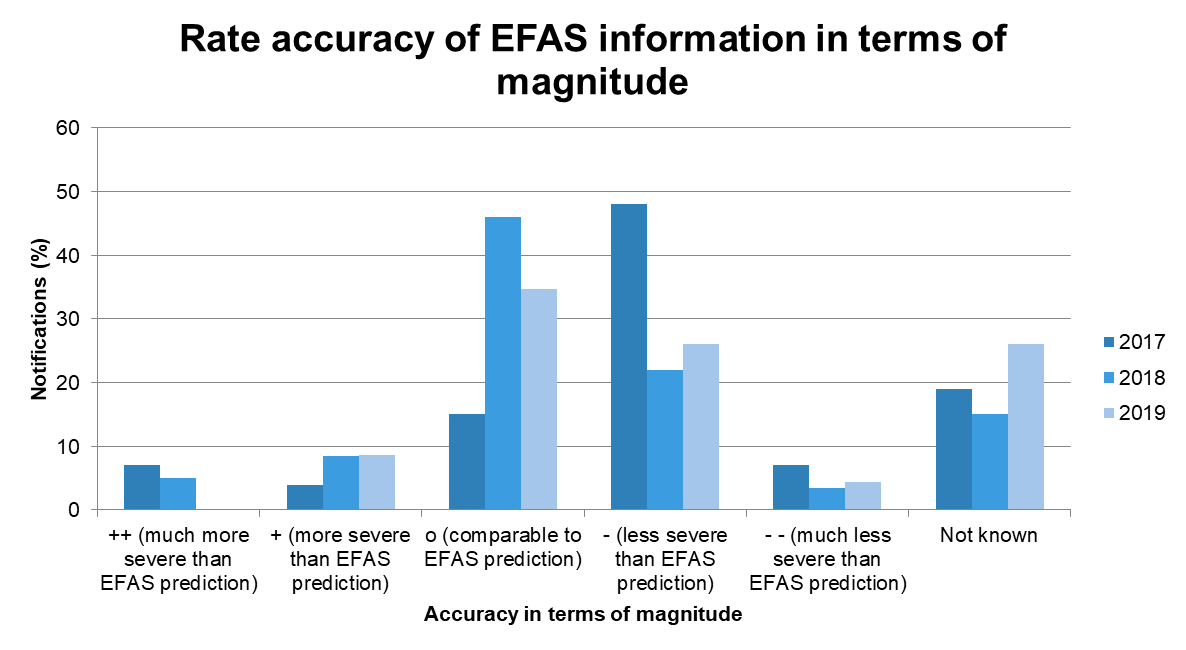
In terms of the magnitude of the predicted event, 35% reported that the flood was comparable to the EFAS prediction (Figure 5). 30% answered that the magnitude was less or much less severe than the EFAS prediction and only 8% stated that the flooding was more or much more severe than the EFAS prediction. Finally, 26% of the respondents were not aware of the magnitude compared to the EFAS notification.
Lead time and return period of notifications for observed events
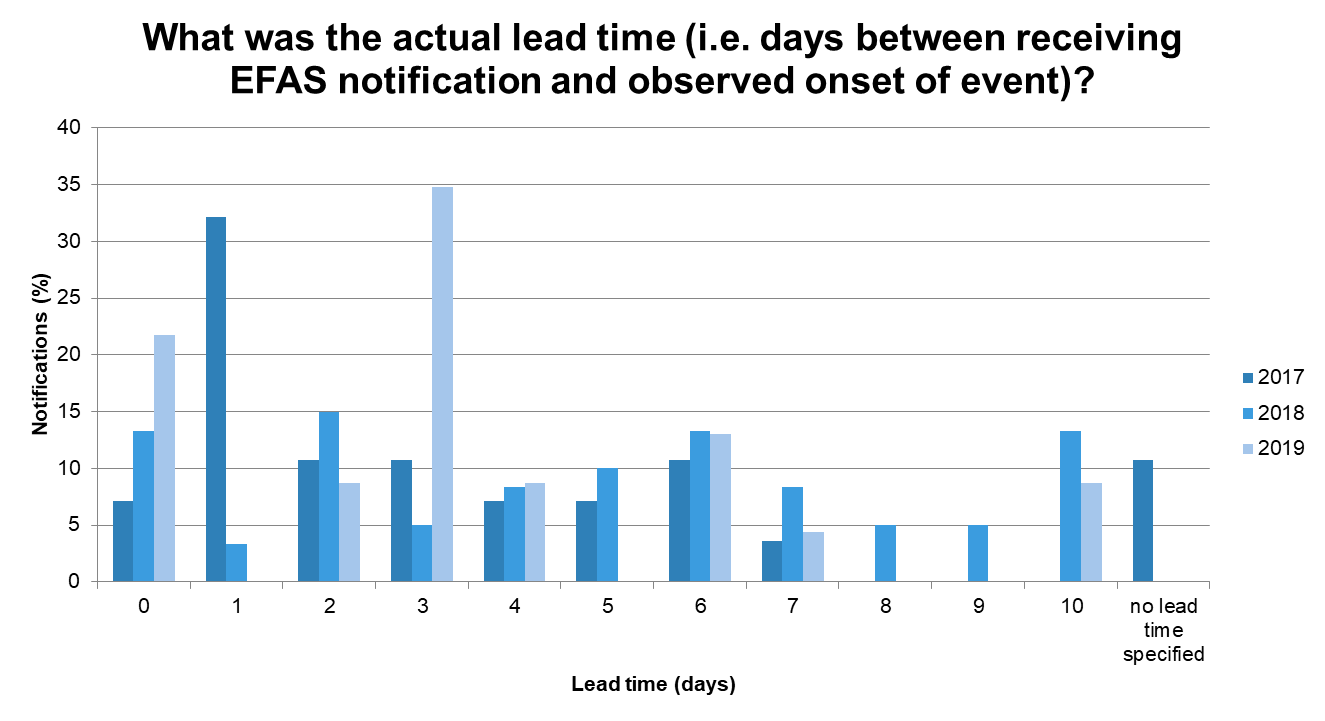
The lead time varied greatly between the different flood events with most events (35%) having three days lead time (Figure 6). The mean and median lead time was 2 days. It is also notable that many events (5 respondents or 21%) had zero days between the notification and start of the event. This is a value higher than in previous years.
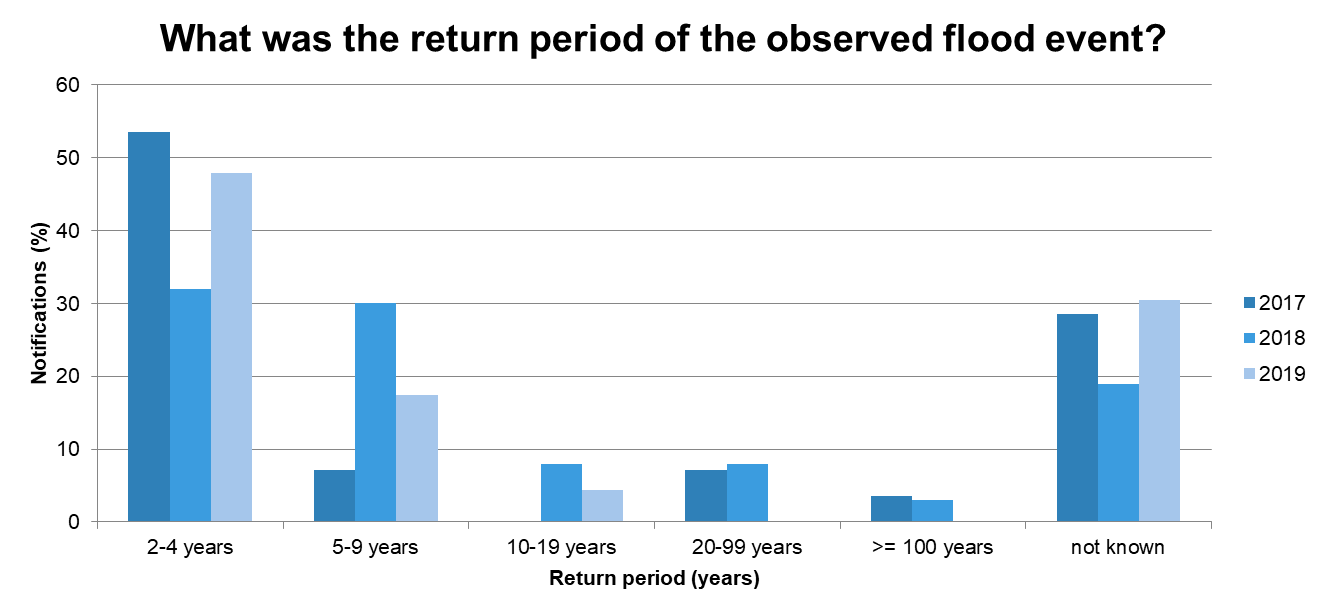
48% of the respondents who reported that the flooding event had indeed occurred stated that the return period of the observed flood event was less than a 5-year return period (Figure 7). Since the criteria for sending out a Formal Notification is a 5-year return period discharge, it is interesting that so many events were less severe than that. The time periods that partners’ use to calculate their return periods is not known. The 5-year return period in EFAS is, for example, often much lower than the 5-year return period threshold that is used in Sweden by the Swedish Meteorological and Hydrological Institute, probably because of the different time periods used in the calculation. In addition, EFAS-based return periods are calculated simulated discharges, whereas the EFAS partners base their thresholds on discharge observations. Calculating return periods from simulated discharges leads to a systematic bias between observed and calculated discharge for certain places. It would maybe be easier for the partners to evaluate the notifications including also a comparison of the EFAS simulated discharge with observed discharge recorded by the partners.
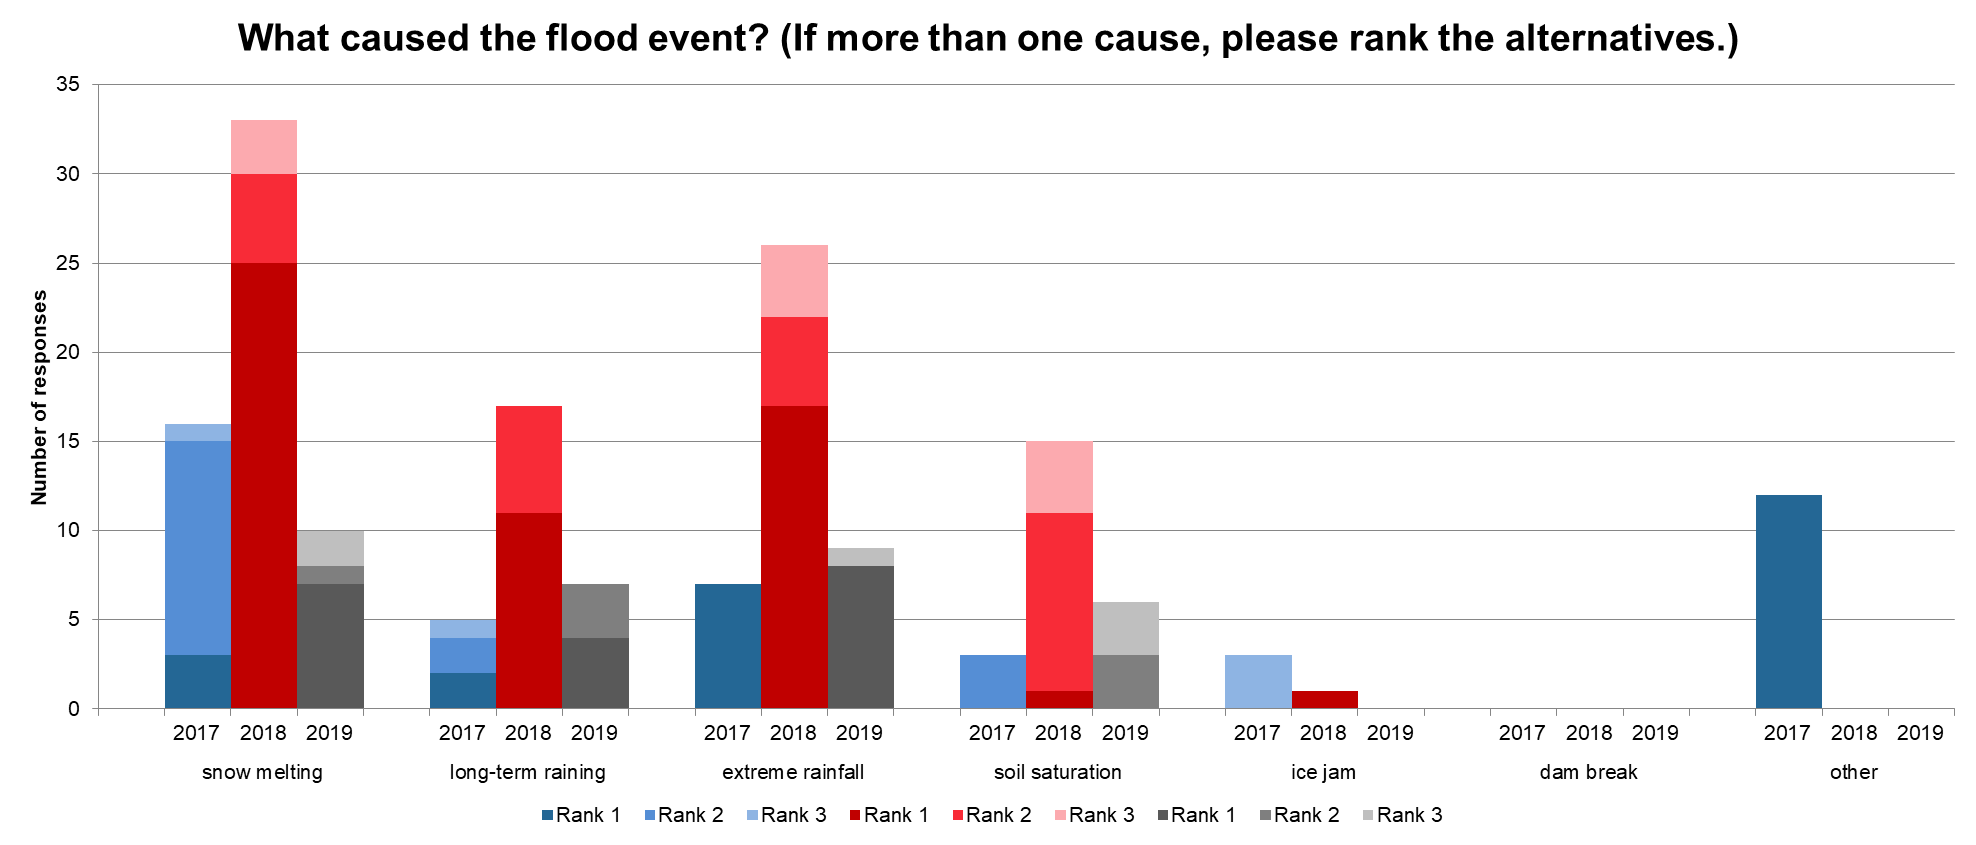
This year's causes for flood events were more spread than in previous years with extreme rainfall (8 reports), snowmelt (7 reports) and long-term raining (4 reports) being ranked as first priority cause most often. Overall, snowmelt (10 reports) and extreme rainfall (9 reports) were the main drivers for flood events (Figure 8).
Notification sent but no observed flooding event
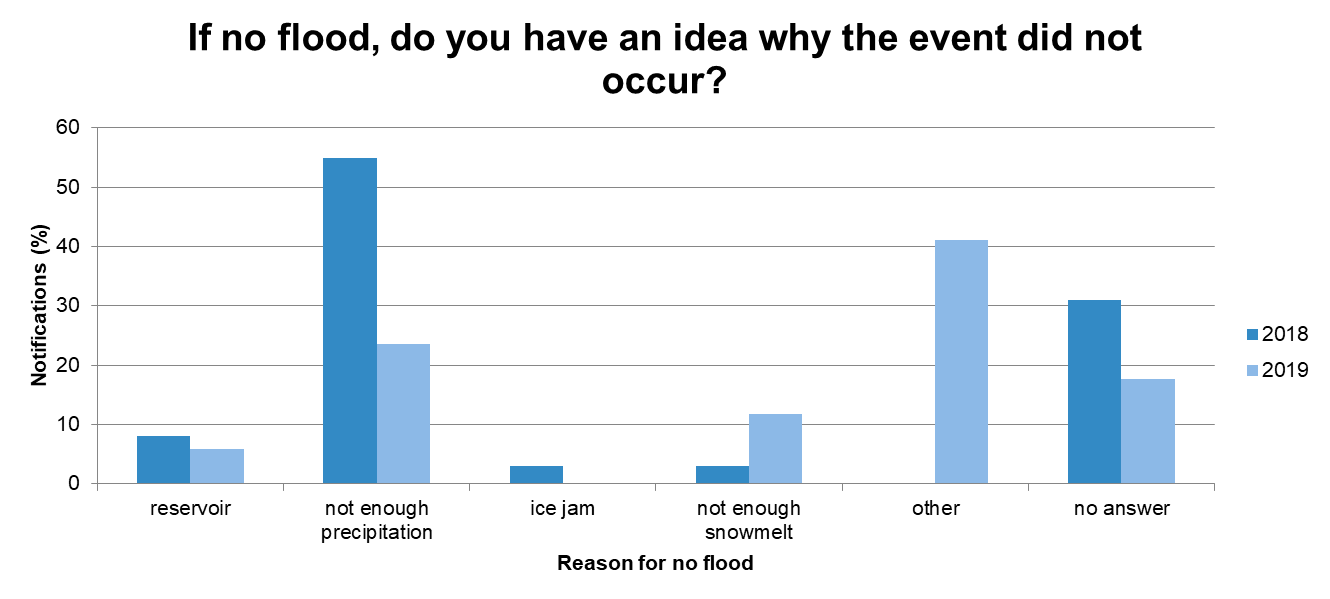
The survey recipients were asked if they had any ideas why the event did not occur; for instance, due to reservoir operation, precipitation accumulated as snow, precipitation fell in other area, forecasted precipitation did not occur, snow did not melt as fast as predicted. The most common answer was "other" (Figure 9). In this category the most often named cause was that the precipitation fell in another region than the flood notification was issued for. Six feedback reports did not explain why the false alarm happened, which may be because they themselves do not know. This question has been added during 2017 and therefore no data is available for that year.